This assembly was delivered to BGS, 23 November 2018. Contact me for the full slideshow.
Is the world getting better?
Thinking generally about the world, all things considered, do you think the world is getting better or worse, or neither getting better nor worse? You choose:
A: Getting better
B: Neither getting better nor getting worse
C: Getting worse
So, what do you reckon? Please vote now.
This is surely one of the most important questions that humanity can ask of itself.

Photo of slum in Dhaka, 2000 (Author)
My faith in human progress was shaken when, almost twenty years ago, I went on a round the world trip which ended up lasting 17 months.
I had learned about development in school and how some people said that rich countries made poor countries poor. This trip was part of what led me into teaching – I felt like I needed to show people what the world was really like.
What I saw – for example, street dwellers in Kolkata and slum dwellers in Dhaka – seemed to back up my preconceptions.

Protests against the WEF in Melbourne, 2000 (Author)
It also led me to take part in protests against what I felt was an unjust situation – of forces, perhaps capitalism, perhaps globalisation – which were dragging the world down – this one happened whilst I was in Melbourne.
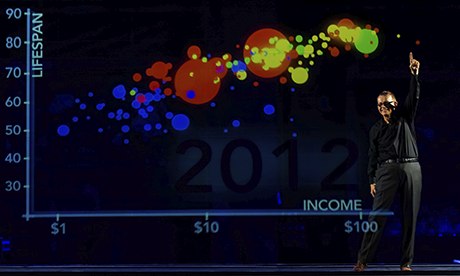
But what I didn’t fully realise was that, yes, extreme poverty was real, and yes, humans do have a capacity to harm each other, but what I was seeing was only what was happening at one point in time, and that over time, progress is being made – people are escaping poverty, they are living longer, more and more people are getting an education, there are growing numbers of democracies, there are fewer wars… In fact, in virtually every social and economic aspect, and in many environmental aspects too, progress is being made.
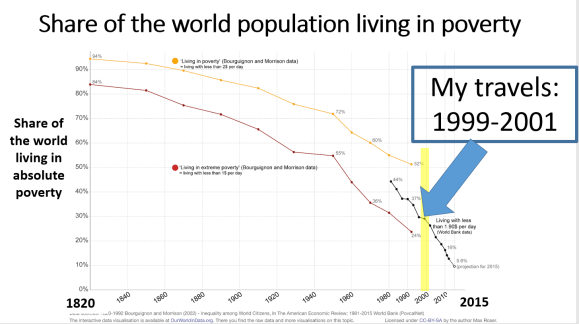
Graph source: Max Roser et al (2018): http://www.ourworldindata.org
The theme of this week is optimism, and I would like you to question both your attitude towards the future and why you hold your opinions.
So, back to the question I kicked off with. I have been doing a little bit of research about your opinions. Thank you to my Year 8, 11 and 12 Geography sets, and ten members of staff I collared at random. So what did these groups believe about the future of the planet?
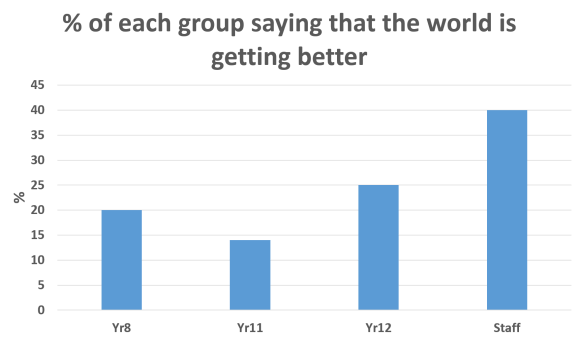
It appears that the staff are more optimistic than the pupils, but that the majority view is that the world is going to carry on as it is, or get worse.
Source: Author’s research; Ipsos-MORI
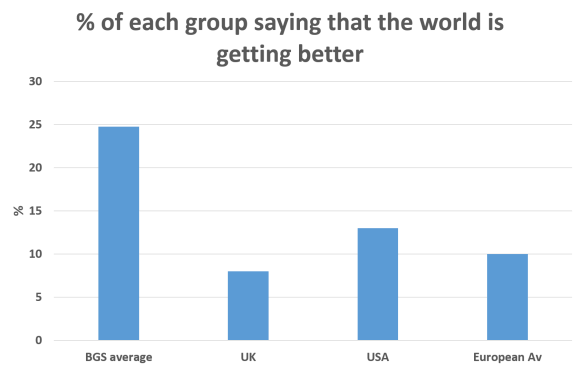
In fact, the BGS average is higher than the results for the UK and similar countries – but it’s still not a resounding victory for optimism. Let’s see what beliefs about the world might lie behind the lack of optimism.
In the last 20 years the proportion of people living in extreme poverty, worldwide, has…?
A. Almost doubled
B. Remained more or less the same
C. Almost halved
Think about it.
The answer is C: Almost halved
I asked the groups for their verdict. Here it is:
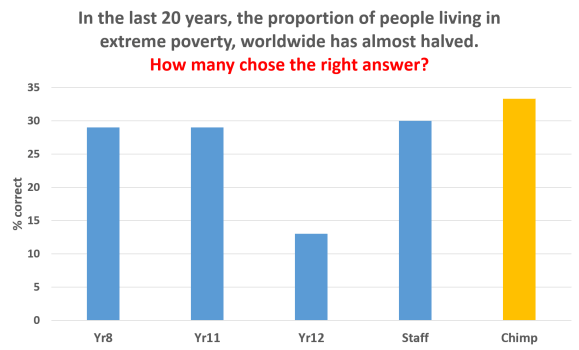
You will notice that I have put a column for a chimp on the right hand side, to represent the 33% chance of the answer being chosen at random (inspired by Hans Rosling, author of Factfulness – show book). So every group here underestimated the true degree of economic progress in the world – their results are worse than random! But why? We’ll come to that later. Next question please.
Slide: In all low income countries across the world today, how many girls finish primary school?
A. 20%
B. 40%
C. 60%
Think about it – what would you have voted?
The answer is C: 60%
How did the respondents do?
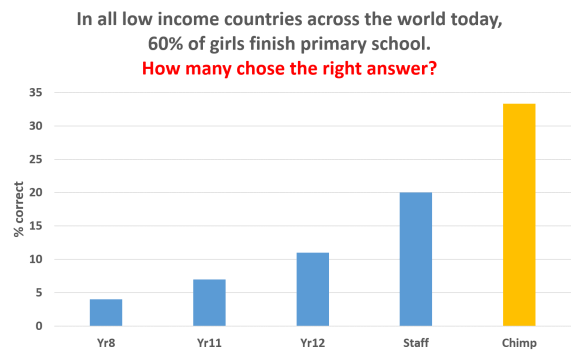
Oh dear – we have underestimated progress yet again. Next question.
Slide: There are two billion children in the world today, aged 0 to 15 years old. How many children will there be in the year 2100 according to the United Nations?
A. 4 billion
B. 3 billion
C. 2 billion
Think about it – what would you have voted?
The answer is C: 2 billion
How did my group do?
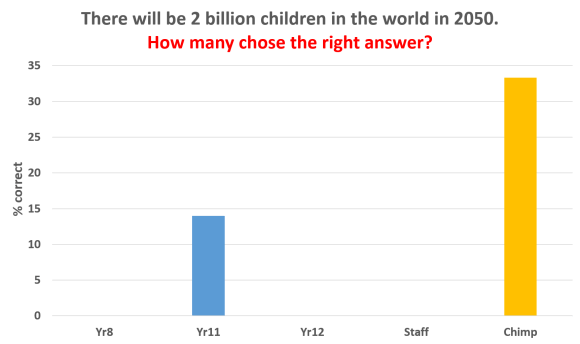
Well done to the two Year 11s who got this correct. To everyone else in my survey – never mind, better luck next time. I will pause to explain this one, because your results were so far out.
The world’s population is now almost 8 billion and it will probably top out at 10-11 billion. Most of this growth is due to today’s children having children, and to people living longer. But it’s not due to more births: women around the world have fewer babies than ever before – the global average is only just over two. In 1960 it was 5. Family planning and good healthcare mean that the so-called ‘population bomb’ has fizzled out.
Let’s have one more question.
Slide: How many people in the world have some access to electricity?
A. 20%
B. 50%
C. 80%
What do you reckon?
The answer is C: 80%
Our survey said…
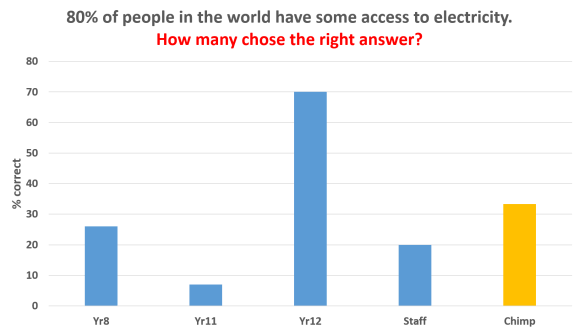
Well done Year 12s!
Here is a summary of just some of the positive trends in the world over the last few decades – it has become more peaceful, more democratic, healthier, better nourished, better educated, more connected, gender equal, and more tolerant.
For example, current UN trends show that the “ending of extreme poverty for all people everywhere” is due to occur by 2026. The end of extreme poverty for all people everywhere – in only eight years – before some of you even turn twenty – is this a dream?
So at least one part of John Lennon’s lyrics – for ‘Imagine’ in 1980 – “Imagine there’s no need for greed or hunger” – is due to be met within perhaps all of our lifetimes – wow.
Lennon also sang “Imagine all the people living life in peace” – might this happen, barring relatively minor skirmishes, by the middle of the century? With wealth comes property and with property comes a degree of calm… Something to ponder.
There are significant challenges facing the world – many of them environmental. Here are some of these challenges: climate change, extremism, cybercrime, pollution, inequality and recessions. I am not saying that you should sit back and do nothing. I am saying that we should carry on striving – and that we should not give up hope.
In summary, many of us underestimate the amount of progress that has been made in the world. This is explored in great depth in books like ‘Factfulness’ by Hans Rosling et al (in the school library).
But don’t blame yourself for getting things wrong! Blame these instead: the media, outdated information, mistrust of good news, and human psychology.
Let’s start with the media: be aware that bad news sells, and most bad news comes suddenly. Good news tends to come slowly.
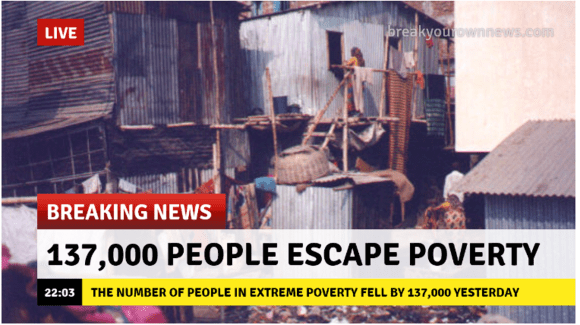
If news outlets truly reported the changing state of the world, they could have run the headline ‘NUMBER OF PEOPLE IN EXTREME POVERTY FELL BY 137,000 SINCE YESTERDAY’ every day for the last twenty-five years.
I acknowledge http://www.breakyourownnews.com for the template (Photo: Author)
Outdated information – this one is quite simple – keep up to date! Watch documentaries, and follow trusted news outlets.
Mistrust of good news: Steven Pinker says “Those who spread fear about a dreadful prophesy may be seen as serious and responsible, while those who are measured are seen as complacent and naïve”. Try to prove him wrong!
Your mind warps your perceptions too. Psychologists talk about anchoring – where we tend stick to the first opinion that we form about a subject, and defend it, often against the weight of evidence.
They also talk about the negativity instinct – negative stories have the edge over positive ones, because of the risks we faced in humanity’s formative years, such as bear attacks.
There is availability bias – a misjudgement where we believe that reality is all we can easily call to mind.
And finally, confirmation bias – where we seek validation rather than challenges to our views.
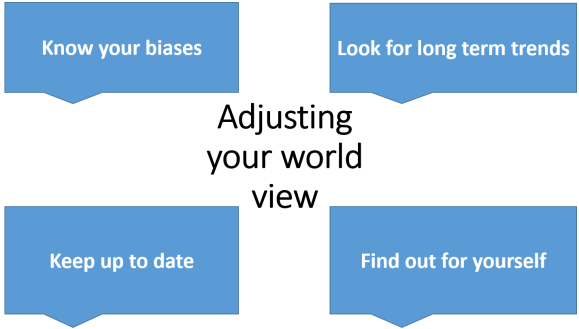
Here are some rules of thumb so you don’t get caught out again! Look for more on the Geography corridor. Why is this important? Negativity allows seeds of discontent and despair to take root. Many people today have difficulty imagining, valuing, or even believing in the promise of incremental change, which leads to a greater appetite for revolutionary change.
Is it time to reconsider your answer to the question we started off with?
Slide: Is the world getting better?
Thinking generally about the world, all things considered, do you think the world is getting better or worse, or neither getting better nor worse? You choose:
A: Getting better
B: Neither getting better nor getting worse
C: Getting worse
Thank you.